systemd-analyze 分析系统上电时间
获取系统上电时间的概要信息
~$ systemd-analyze
Startup finished in 8.538s (kernel) + 11.783s (initrd) + 1min 19.618s (userspace) = 1min 39.940s
查看各服务启动所需的时间
~$ systemd-analyze --no-pager blame
         22.540s network.service
         20.154s ceph-osd@10.service
         20.153s ceph-osd@18.service
         20.153s ceph-osd@25.service
         20.153s ceph-osd@16.service
         20.148s ceph-osd@24.service
         20.147s ceph-osd@22.service
         20.147s ceph-osd@13.service
          9.649s iptable-tools.service
          5.184s pacemaker.service
          2.108s performance.service
          2.064s kdump.service
          1.656s ovs-vswitchd.service
...
查看服务依赖链上各节点启动所需的时间
~$ systemd-analyze --no-pager critical-chain ceph-osd@10.service
The time after the unit is active or started is printed after the "@" character.
The time the unit takes to start is printed after the "+" character.

ceph-osd@10.service +20.154s
└─network-online.target @32.574s
  └─network.target @32.491s
    └─network.service @9.943s +22.540s
      └─openvswitch.service @9.930s +6ms
        └─ovs-vswitchd.service @8.265s +1.656s
          └─ovsdb-server.service @7.865s +390ms
            └─basic.target @7.668s
              └─sockets.target @7.663s
                └─iscsiuio.socket @7.656s
                  └─sysinit.target @7.566s
                    └─systemd-update-utmp.service @7.546s +11ms
                      └─auditd.service @7.399s +139ms
                        └─systemd-tmpfiles-setup.service @7.334s +47ms
                          └─rhel-import-state.service @7.286s +38ms
                            └─local-fs.target @7.271s
                              └─var-lib-libvirt-qemu-ram.mount @35.413s
                                └─var.mount @6.852s +10ms
                                  └─systemd-fsck@dev-mapper-vg_sys\x2dlv_var.service @6.832s +18ms
                                    └─local-fs-pre.target @6.804s
                                      └─lvm2-monitor.service @6.763s +30ms
                                        └─dm-event.socket @988ms
                                          └─-.slice
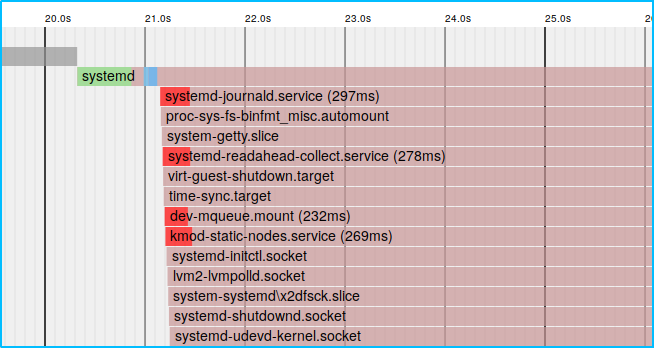
将各服务的启动时间以树状图的形式呈现
~$ systemd-analyze plot > boot.svg
查看服务依赖关系:
$ systemctl list-dependencies
default.target
● ├─accounts-daemon.service
● ├─gdm.service
● ├─nvmefc-boot-connections.service
● ├─rtkit-daemon.service
● ├─systemd-update-utmp-runlevel.service
● ├─udisks2.service
● └─multi-user.target
●   ├─atd.service
●   ├─auditd.service
●   ├─avahi-daemon.service
参考资料
man systemd-analyze
systemd-analyze – Find System Boot-up Performance Statistics in Linux
https://www.tecmint.com/systemd-analyze-monitor-linux-bootup-performance/
Improving performance/Boot process
https://wiki.archlinux.org/index.php/Improving_performance/Boot_process
systemd/Timers
https://wiki.archlinux.org/index.php/Systemd/Timers
最后修改于 2019-03-05